Most companies approach AI investment the same way they approach a new marketing campaign: spend the budget, hope something moves, measure what you can. But AI is not a campaign. It's infrastructure. And infrastructure requires a completely different kind of financial thinking.
The hard truth is that most AI ROI calculations are either too optimistic — projecting full benefits from day one, as if the system goes live fully functional on a Monday morning — or too vague to be actionable. "AI will make our team more productive" is not a financial model. Neither version survives contact with your CFO, your board, or honestly, reality.
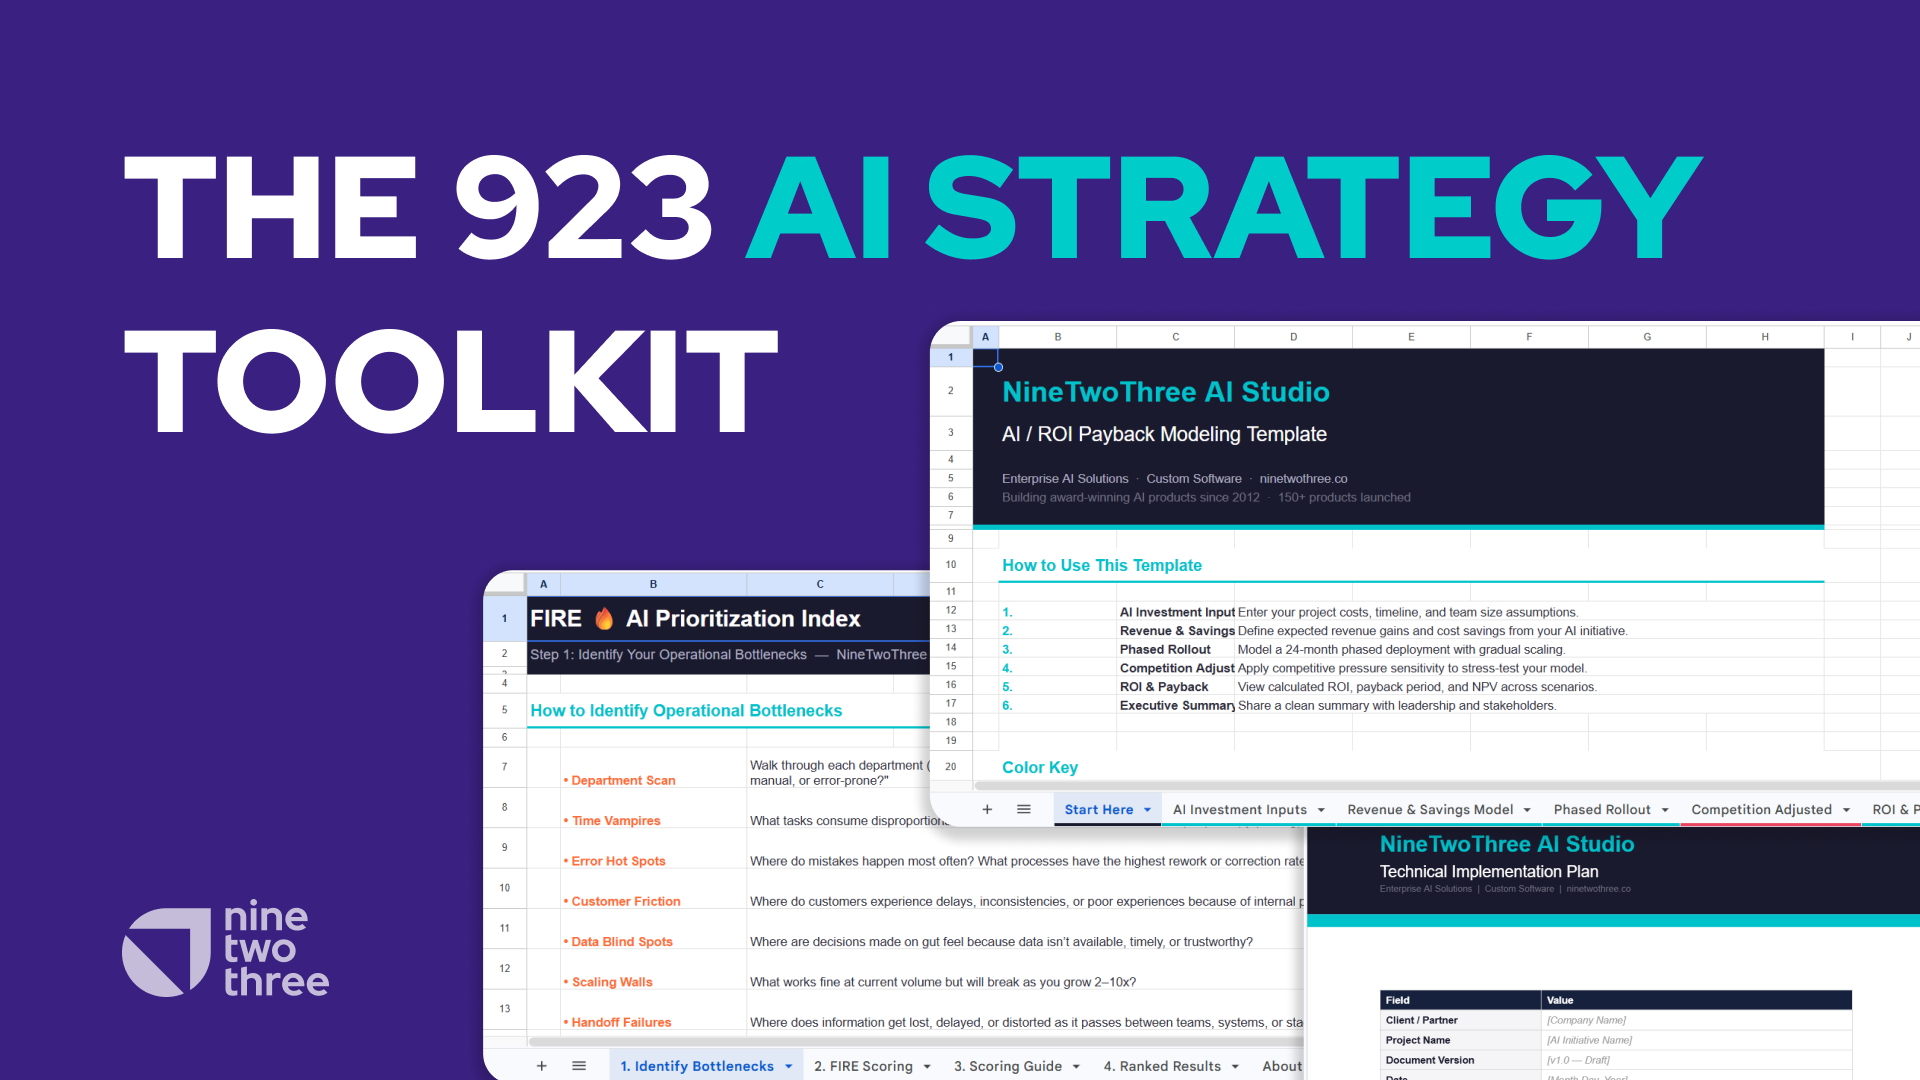
What you need is a structured, honest model that accounts for the messy reality of implementation, the gradual curve of adoption, and the competitive pressure that will erode your edge over time. This post walks through exactly that framework, using the actual numbers and formulas from our AI ROI Payback Modeling Template.
You can read till the end and download this template with a full AI strategy, operational bottleneck audit, prioritization index, and technical implementation plan to try them yourself.
Or, if you'd like, you can do that here.
A credible AI ROI calculation has four distinct components:
Each one feeds into the final output: a payback period, an annual ROI, a 24-month net return, and an Net Present Value (NPV). Leave any piece out and your model is working from incomplete information. And since the most common place models go wrong is right at the start, with costs that are quietly undercounted before the analysis even begins, that's where we'll start
The "I" in ROI is harder to calculate than it looks. Most organizations undercount their investment because they track the obvious line item, the development contract, and ignore everything surrounding it. By the time the hidden costs surface, the budget has already been approved on false assumptions.
There are four cost categories that belong in every AI investment calculation. Most organizations budget for the first one and underestimate or skip the rest entirely - which is precisely why projects run over and ROI models miss.
This is the core engineering work: designing the system architecture, selecting and configuring the right models, building the application logic, testing across real-world scenarios, and iterating based on what breaks. It's the most visible cost and also the most variable, because it depends almost entirely on what you're building and how custom it needs to be.
Market ranges give you a useful starting framework. AI development costs vary widely: $5,000–$50,000 for simple chatbots, $50,000–$150,000 for moderate machine learning projects, and $150,000–$1M+ for complex LLM or computer vision systems. For most mid-market businesses building a meaningful workflow automation or AI-assisted process - not a chatbot, not a frontier model - you're typically looking at the $75,000–$200,000 range for a well-scoped custom solution.
What's often underestimated here is the internal cost. The vendor quote covers their engineers' time. It doesn't cover your product manager's hours spent on requirements, your engineers' time on API access and internal tooling, your QA team's testing cycles, or your leadership's decision-making bandwidth. Add 20–30% to the vendor quote to account for the internal effort that a realistic build actually requires.
Before your AI can do anything useful, your data has to be clean, structured, labeled, and accessible. This sounds straightforward until you're looking at five years of PDFs stored in a shared drive, customer records split across three CRMs that were never reconciled, and operational data that lives in a spreadsheet someone updates manually each Monday.
Data preparation is the most commonly underestimated cost in AI projects, and the one most likely to blow your timeline. In some projects, it ends up larger than the AI build itself.
A practical rule of thumb: for organizations with reasonably organized, centralized data, budget data prep at 15–20% of your development cost. For organizations with significant data debt - legacy systems, inconsistent formats, siloed databases, years of unstructured files - budget 25–35%. If you're in a highly regulated industry where data needs to be anonymized, audited, or specially handled, add another 5–10% on top.
This covers connecting your AI to your existing infrastructure - your CRM, your ERP, your internal tools, your customer-facing systems, whatever it needs to talk to in order to actually work. On paper, this is a straightforward engineering task. In practice, it's where builds most commonly stall.
APIs break. Legacy systems don't cooperate. A dependency turns out to be undocumented. Scope expands when stakeholders realize that "connected AI" means more than they assumed. Plan for surprises. For standard integrations with modern systems, budget integration at 10–15% of your development cost. For legacy environments, older ERPs, or heavily customized internal tools, budget 20–30%.
This is the line item that gets cut first and costs the most when it's missing. An AI system that your team doesn't trust, doesn't understand, or uses inconsistently delivers a fraction of its potential value. The ROI model doesn't know the difference between an AI running at full adoption and one that 40% of the team has quietly stopped using because no one trained them properly.
Change management includes internal training programs, documentation, workflow redesign, leadership communication, and the ongoing reinforcement required to actually shift how people work day to day. This isn't a soft cost - it directly determines your adoption rate, and your adoption rate directly determines every benefit figure in the model. For a focused, single-team deployment, budget $5,000–$15,000. For a company-wide rollout touching multiple departments, $20,000–$40,000 is not unusual and frequently worth it.
Let's make this concrete with a hypothetical case we'll carry through the rest of this blog post.
Say you're a 120-person operations consulting firm. Your consultants spend a significant portion of their week doing work that is high-effort but low-judgment: pulling data from internal systems, drafting status reports, formatting client deliverables, and manually tracking project milestones across spreadsheets. You've decided to build a generative AI copilot - integrated into your existing project management and document systems - that automates the first draft of reports, surfaces project anomalies in real time, and handles routine client update emails. Your consultants review and approve; the AI handles the production work.
Your data is reasonably well-structured (project records, client histories, deliverable archives) but spread across two internal platforms that don't talk to each other. The integration is manageable but not trivial.
Here's how the one-time cost picture looks:
Before you finalize that subtotal, add 10% on top. Always. Scope creep, undocumented dependencies, or an extra round of model fine-tuning after user testing will surface in almost every project. Planning for it is not pessimism - it's pattern recognition.
10% on $185,000 = $18,500. Total Initial Investment: $203,500. Your numbers will look different depending on what you're building and how complex your environment is, but the formula is always the same
Once the system is live, the costs shift rather than stop. You're paying every month to keep it running, and these recurring costs matter more than they appear because they start from Month 1, including during the build phase, before you've earned a dollar of return.
Infrastructure & Cloud covers server costs, API usage, hosting, and any third-party AI model access fees. If you're calling a foundation model via API, you're paying per token, and that cost scales with usage volume. If you're self-hosting a fine-tuned model, you're paying for compute. For a mid-market deployment like our consulting firm example, cloud infrastructure typically runs $1,500–$3,000/month. This number creeps up as adoption scales, so build in a usage-scaling assumption rather than treating it as fixed.
Ongoing Maintenance covers the engineering hours required to keep the system performing well: bug fixes, performance monitoring, retraining models as your data evolves, and adapting to changes in connected systems. AI systems that aren't actively maintained degrade - models drift, integrations break, edge cases accumulate. Annual maintenance typically runs 15–25% of your original development cost. For our $130,000 build, that's roughly $20,000–$32,000 per year, or around $1,700–$2,700/month.
In our hypothetical case, total recurring costs come to approximately $3,500/month. That monthly number is the constant headwind in your cash flow: a cost you're paying from Month 1, through the build phase, through the pilot, all the way to steady state and beyond.
AI generates financial value through two channels. Most organizations are good at identifying one and blind to the other. Getting both right, and being specific about how you arrive at each number, is what separates a defensible business case from a wish list.
Let's continue with the same hypothetical case from Part 1: a 120-person operations consulting firm that has deployed a generative AI copilot to automate report drafting, surface project anomalies, and handle routine client communications. Total initial investment: $203,500. Monthly recurring cost: $3,500. Now let's figure out what it's worth.
Revenue impact breaks into two sub-categories, each requiring a different estimation approach.
New revenue enabled is the business you couldn't do before - or couldn't do at this volume. The key question to ask is: what operational constraint is AI removing, and what does unlocking that constraint make possible?
The formula:
In our consulting firm example, the AI copilot cuts the time each consultant spends on reporting and admin from roughly 40% of their week to around 10%. That's 30% of each consultant's time returned to billable work. Across a team of 40 consultants at an average billing rate of $150/hour, working 160 hours per month, that's roughly 1,920 hours of recaptured capacity per month. Even if only half of that converts to actual billable time, that's 960 additional billable hours, or around $144,000 in potential new monthly revenue.
Your numbers will look different. The formula stays the same: identify the specific constraint the AI removes, calculate the capacity it frees up, and apply your conversion rate and billing rate to get a dollar figure. Avoid the temptation to say "AI will increase revenue by X%" without tracing it back to a mechanism. That's a guess, not a model.
Revenue uplift from existing channels is more subtle: it's the same business, performing measurably better. In our example, faster, more consistent client reporting reduces churn. Real-time project anomaly detection means issues get flagged before they become escalations, improving client satisfaction scores and renewal rates. Faster turnaround on deliverables wins competitive pitches that previously went to whoever responded first.
The formula:
For the improvement percentage, pick one or two specific metrics the AI will directly influence - churn rate, renewal rate, win rate on competitive bids - and apply a conservative 3-7% improvement. In our example, if the firm's monthly recurring revenue from retainer clients is $500,000 and a 5% churn reduction is realistic, that's $25,000/month in protected revenue that would otherwise have been at risk.
As with new revenue, be specific about the mechanism. "AI will improve client satisfaction" is not a model. "Faster reporting reduces the primary complaint in our churn exit interviews, which we estimate will lower monthly churn by 5%" is a model.
Here's where most organizations leave money on the table in their ROI models, because they frame savings too narrowly.
The default framing is headcount reduction: fewer people needed, salary costs go down. That framing is both financially incomplete and organizationally counterproductive. The more accurate, and more financially significant framing is capacity expansion.
In our consulting firm example, the AI doesn't replace any consultants, but gives each of them back 30% of their week. That recaptured time is the asset. The question is what your organization does with it, and modeling that answer honestly is where your cost savings estimate lives.
The formula:
For our case: 40 consultants × 48 recaptured hours/month × $75 loaded cost/hour (salary plus benefits, not billing rate) × 50% productive reallocation rate = $72,000/month in labor value redirected to higher-value work. Note that this overlaps with the new revenue figure above - in practice, you'd choose one framing or the other depending on whether those recaptured hours convert to billable time (revenue) or internal efficiency (cost saving). Don't double-count.
That last variable - productive reallocation rate - is the honest one. In most organizations it sits between 50-70%. Be realistic. Overstating it is where labor savings estimates most commonly fall apart when they meet reality.
Operational efficiency savings come from the automation itself reducing cost-per-deliverable: fewer revision cycles because the AI's first draft is already well-structured, less supervisory time per output, fewer errors reaching the client. In our example, if the firm currently spends roughly $15,000/month on rework and revision cycles, and the AI reduces that by 60%, that's $9,000/month in operational savings.
Other savings - reduced software subscriptions made redundant by the AI, lower compliance overhead from automated audit trails - are real but hard to estimate precisely. Keep this conservative. In our example, call it $2,000/month.
Add everything together to get total monthly benefit at full steady-state adoption:
In our hypothetical case: $144,000 (new billable capacity) + $25,000 (churn protection) + $9,000 (efficiency) + $2,000 (other) = $180,000/month. That's a high-end figure for this scenario, and in practice you'd stress-test each input. The point isn't the specific number - it's the method.
Then apply your profit margin to convert gross benefit into net profit:
For a consulting firm, a 50% margin is reasonable. That gives us $90,000/month in net profit at steady state in our example - the number we'll carry into the phased rollout model in Part 3.
The margin input matters more than most people realize because it applies to every dollar of benefit across all 24 months. A 10-percentage-point swing in margin meaningfully changes both your payback period and your 24-month return. Use your actual business margin if you have it. If you're benchmarking: professional services typically runs 40-60%, software and SaaS runs 60-75%, retail and manufacturing runs lower. When in doubt, be conservative. A model that holds up at 45% margin is a stronger business case than one that only works at 65%.
So, this is the moment when most AI ROI projections fall apart. They assume the benefits start on day one, or close to it: launch the system in January, start collecting $90,000/month in profit by February.
That is not how AI deployments work.
A realistic deployment follows four distinct phases over 24 months. Modeling them honestly is what separates a credible business case from one that creates false expectations - and eventual credibility problems.
Let's walk through all four phases using our consulting firm example: $203,500 in total initial investment, $3,500/month in recurring costs, and $90,000/month in net profit at full steady-state adoption.
For the first four months, you are building. Engineering is underway. Data is being consolidated and structured. Integrations are being developed and tested. Your pilot group is being identified and trained.
During this entire period: zero benefits, ongoing costs.
Every month, the consulting firm is paying $3,500 in recurring infrastructure costs. By the end of Month 4, they've spent $203,500 in initial investment plus $14,000 in recurring costs - and the cumulative position is firmly negative. The system hasn't generated a dollar.
This is uncomfortable for anyone who wants fast ROI, but it's the reality. Modeling it honestly is also useful: it tells you the exact cash flow hole you're committing to before returns arrive, which lets you plan for it rather than be surprised by it.
In Month 5, the system goes live, but not at full scale. You're running a controlled deployment with a subset of users, workflows, or volume. Real usage, real feedback, real edge cases surfacing in real conditions.
The model applies 25% of steady-state benefits during the pilot phase. For our hypothetical consulting firm, that looks like:
After two months of piloting, cumulative profit turns positive for the first time - but you're still well short of recovering the initial investment. The pilot phase isn't about financial return. It's about validating that your benefit assumptions hold in the real world before you commit to full rollout.
This is the most dynamic phase of the model. Adoption increases linearly from 25% to 100% across six months. Each month, more consultants are using the system, more deliverables run through it, more of the projected benefit is being realized.
Here's what that ramp looks like in our example:
By the end of Month 12, the initial investment has been well on its way to recovery, and the firm is approaching full productive capacity. Your own table will look different depending on your numbers - but the shape of the curve will be the same: slow at first, then accelerating as adoption spreads.
One practical note on the ramp: 25% to 100% over six months assumes a smooth, managed rollout - active change management, dedicated user support, and leadership accountability for adoption metrics. In organizations where rollout happens organically (users opt in when they feel like it, training is ad hoc, metrics aren't tracked), this ramp drags. Six months becomes twelve. The payback period extends accordingly. This is why change management isn't a soft cost.
Starting in Month 13, you're at 100% adoption. Every unit of projected benefit is being realized, every month.
This is the phase where the investment truly compounds. Each month adds another $88,250 in net profit. By Month 24, cumulative profit is substantial - well beyond the initial investment, and growing.
That's the honest version of the growth curve: not a hockey stick that starts immediately, but a realistic S-curve that accounts for build time, learning, and ramp-up, and then delivers durable, compounding returns once the system is fully operational. The download template will calculate all of this automatically once you enter your own inputs.
Everything above is the base case. It assumes you execute well, adopt fully, and operate in a market that stays roughly constant. None of those assumptions are guaranteed.
Cloudera found that for 96% of enterprises AI is at least somehow integrated into their processes. Your competitors are evaluating AI right now. Some will adopt faster than you. When they do, your win rates, your pricing power, and your market share will come under pressure, and a model that only worked in a static market will start to look optimistic.
A credible financial model answers a harder question: how much can go wrong before this investment stops making sense?
The template's competition adjustment applies four pressure inputs simultaneously.
Market share erosion (15%): When competitors deploy AI-enhanced capabilities - faster turnaround, better personalization, more competitive pricing - they win business you would have previously won. Your addressable opportunity shrinks. Applied to the model, this pulls your monthly benefit from $95,000 down to $80,750: a $14,250/month reduction that flows through every future period.
How to set this number for your business: look at your market and estimate how quickly competitors are likely to reach AI parity. In fast-moving markets (SaaS, e-commerce, financial services), 15% is conservative - erosion could be steeper and faster. In slower-moving markets (industrial, specialty manufacturing, regulated industries), 5–10% might be more realistic.
The point isn't to be precise; it's to run a scenario that doesn't assume you maintain 100% of your current position forever.
Win rate pressure (10%): Even for the deals you're pursuing, you're closing at a lower rate. Competitors are offering AI-enhanced alternatives - faster proposals, better-tailored solutions, more responsive support. Your win rate erodes. In the template, this is captured in the margin compression rather than as a separate volume reduction.
Price pressure (10%): To stay competitive, you're discounting. This compresses your effective profit margin from 55% to 44% - a 20% relative reduction in profitability. Pricing pressure is one of the most underappreciated AI risks: when your AI-driven efficiencies become table stakes in your market, you can't charge a premium for them anymore. You've invested to maintain parity, not to gain advantage.
Adoption delay (2 months): Competitive disruption can slow your own internal rollout. Sales cycles lengthen as customers become more sophisticated. Implementation complexity increases as you try to differentiate. Add two months to your timeline.
Running all four adjustments together produces a noticeably different, but still compelling picture:
That's a 32% reduction in annual ROI from competitive pressure. Meaningful, but the investment still makes sense. A 204% annual ROI clears almost any reasonable hurdle rate.
The deeper question the competition adjustment is designed to answer is about NPV. With a 10% annual discount rate applied to the 24-month cash flows, the base case NPV is $483,000. A positive NPV means the investment generates more value than the minimum required return on capital.
If you ran the competition-adjusted scenario through the same NPV calculation and got a negative number, that would mean the investment barely clears its cost of capital under realistic market conditions - and you'd want to revisit your assumptions before proceeding.
If your NPV turns negative under even moderate competitive pressure, you don't have a durable investment thesis. You have one that requires everything to go right. That's the scenario worth catching in the model, not after the fact.
Pull all four components together and the model produces a complete financial picture. Using the template's base scenario with the example inputs:
Base case: $209,000 total initial investment. $3,500/month in recurring costs. $52,250/month in net profit at steady state. Payback period of approximately 4 months after reaching steady state - meaning the investment is recovered by Month 13. 24-month net return of $1,038,000. 24-month ROI of approximately 497%. NPV of $483,000 at a 10% discount rate.
Under competitive pressure: Adjusted monthly profit of $35,530. Payback of approximately 6 months post-steady-state. 24-month adjusted return of $636,720. Adjusted annual ROI of 204%.
The executive summary view shows both scenarios side by side - the base case and competition-adjusted metrics - which is exactly what a CFO or board needs to make an informed decision. Not the optimistic scenario, but the range.
Running this model against your own situation is straightforward once you understand what each input actually represents. A few practical notes.
You probably have a real development quote or budget range - use that. For data preparation, if you don't have an estimate yet, start with 15–20% of your development cost for organized data environments, and 25–30% for organizations with significant legacy data complexity. For system integration, 10–15% of development cost is a reasonable starting point for standard integrations; custom or legacy environments can run higher.
This single number has a dramatic effect on your output because it's applied to every dollar of benefit across all 24 months. A swing from 40% to 60% changes your monthly net profit by nearly $19,000 - which changes your payback period by months and your 24-month return by hundreds of thousands of dollars. Use your actual business margin if you have it. If you're in professional services, 50–65% is typical. Software businesses often run higher. Retail and manufacturing run lower.
The most common modeling mistake is assigning a revenue uplift percentage without tracing it to a mechanism. "AI will increase revenue by 15%" is not a model - it's a wish. "AI-assisted qualification will let our sales team work 40% more leads at the same close rate, generating $X in additional closed deals per month" is a model. The more specific you are, the more defensible your numbers are, and the more useful the model is for identifying where to focus implementation effort.
The scenario doesn't assume competitors will immediately match you - it asks whether your investment thesis survives a market that doesn't stay static for 24 months. If the answer requires the base case assumptions to hold perfectly throughout, your thesis is fragile. Better to know that now.
The template includes a clean summary tab designed to be shared with leadership. It shows both the base case and competition-adjusted metrics side by side, with a space for your investment recommendation narrative. That's what belongs in a board deck, not the raw phased rollout table.
Every number in this post came from real formulas applied to real inputs. The same model is available for you to run against your own scenario.
The template has six tabs:
Fill in your numbers. Watch the model build. Then go into your next AI investment conversation knowing exactly what you're committing to, and exactly what you expect in return.
Additionally the toolkit includes AI Prioritization Index and AI Technical Implementation Plan.
Most companies approach AI investment the same way they approach a new marketing campaign: spend the budget, hope something moves, measure what you can. But AI is not a campaign. It's infrastructure. And infrastructure requires a completely different kind of financial thinking.
The hard truth is that most AI ROI calculations are either too optimistic — projecting full benefits from day one, as if the system goes live fully functional on a Monday morning — or too vague to be actionable. "AI will make our team more productive" is not a financial model. Neither version survives contact with your CFO, your board, or honestly, reality.
What you need is a structured, honest model that accounts for the messy reality of implementation, the gradual curve of adoption, and the competitive pressure that will erode your edge over time. This post walks through exactly that framework, using the actual numbers and formulas from our AI ROI Payback Modeling Template.
You can read till the end and download this template with a full AI strategy, operational bottleneck audit, prioritization index, and technical implementation plan to try them yourself.
Or, if you'd like, you can do that here.
A credible AI ROI calculation has four distinct components:
Each one feeds into the final output: a payback period, an annual ROI, a 24-month net return, and an Net Present Value (NPV). Leave any piece out and your model is working from incomplete information. And since the most common place models go wrong is right at the start, with costs that are quietly undercounted before the analysis even begins, that's where we'll start
The "I" in ROI is harder to calculate than it looks. Most organizations undercount their investment because they track the obvious line item, the development contract, and ignore everything surrounding it. By the time the hidden costs surface, the budget has already been approved on false assumptions.
There are four cost categories that belong in every AI investment calculation. Most organizations budget for the first one and underestimate or skip the rest entirely - which is precisely why projects run over and ROI models miss.
This is the core engineering work: designing the system architecture, selecting and configuring the right models, building the application logic, testing across real-world scenarios, and iterating based on what breaks. It's the most visible cost and also the most variable, because it depends almost entirely on what you're building and how custom it needs to be.
Market ranges give you a useful starting framework. AI development costs vary widely: $5,000–$50,000 for simple chatbots, $50,000–$150,000 for moderate machine learning projects, and $150,000–$1M+ for complex LLM or computer vision systems. For most mid-market businesses building a meaningful workflow automation or AI-assisted process - not a chatbot, not a frontier model - you're typically looking at the $75,000–$200,000 range for a well-scoped custom solution.
What's often underestimated here is the internal cost. The vendor quote covers their engineers' time. It doesn't cover your product manager's hours spent on requirements, your engineers' time on API access and internal tooling, your QA team's testing cycles, or your leadership's decision-making bandwidth. Add 20–30% to the vendor quote to account for the internal effort that a realistic build actually requires.
Before your AI can do anything useful, your data has to be clean, structured, labeled, and accessible. This sounds straightforward until you're looking at five years of PDFs stored in a shared drive, customer records split across three CRMs that were never reconciled, and operational data that lives in a spreadsheet someone updates manually each Monday.
Data preparation is the most commonly underestimated cost in AI projects, and the one most likely to blow your timeline. In some projects, it ends up larger than the AI build itself.
A practical rule of thumb: for organizations with reasonably organized, centralized data, budget data prep at 15–20% of your development cost. For organizations with significant data debt - legacy systems, inconsistent formats, siloed databases, years of unstructured files - budget 25–35%. If you're in a highly regulated industry where data needs to be anonymized, audited, or specially handled, add another 5–10% on top.
This covers connecting your AI to your existing infrastructure - your CRM, your ERP, your internal tools, your customer-facing systems, whatever it needs to talk to in order to actually work. On paper, this is a straightforward engineering task. In practice, it's where builds most commonly stall.
APIs break. Legacy systems don't cooperate. A dependency turns out to be undocumented. Scope expands when stakeholders realize that "connected AI" means more than they assumed. Plan for surprises. For standard integrations with modern systems, budget integration at 10–15% of your development cost. For legacy environments, older ERPs, or heavily customized internal tools, budget 20–30%.
This is the line item that gets cut first and costs the most when it's missing. An AI system that your team doesn't trust, doesn't understand, or uses inconsistently delivers a fraction of its potential value. The ROI model doesn't know the difference between an AI running at full adoption and one that 40% of the team has quietly stopped using because no one trained them properly.
Change management includes internal training programs, documentation, workflow redesign, leadership communication, and the ongoing reinforcement required to actually shift how people work day to day. This isn't a soft cost - it directly determines your adoption rate, and your adoption rate directly determines every benefit figure in the model. For a focused, single-team deployment, budget $5,000–$15,000. For a company-wide rollout touching multiple departments, $20,000–$40,000 is not unusual and frequently worth it.
Let's make this concrete with a hypothetical case we'll carry through the rest of this blog post.
Say you're a 120-person operations consulting firm. Your consultants spend a significant portion of their week doing work that is high-effort but low-judgment: pulling data from internal systems, drafting status reports, formatting client deliverables, and manually tracking project milestones across spreadsheets. You've decided to build a generative AI copilot - integrated into your existing project management and document systems - that automates the first draft of reports, surfaces project anomalies in real time, and handles routine client update emails. Your consultants review and approve; the AI handles the production work.
Your data is reasonably well-structured (project records, client histories, deliverable archives) but spread across two internal platforms that don't talk to each other. The integration is manageable but not trivial.
Here's how the one-time cost picture looks:
Before you finalize that subtotal, add 10% on top. Always. Scope creep, undocumented dependencies, or an extra round of model fine-tuning after user testing will surface in almost every project. Planning for it is not pessimism - it's pattern recognition.
10% on $185,000 = $18,500. Total Initial Investment: $203,500. Your numbers will look different depending on what you're building and how complex your environment is, but the formula is always the same
Once the system is live, the costs shift rather than stop. You're paying every month to keep it running, and these recurring costs matter more than they appear because they start from Month 1, including during the build phase, before you've earned a dollar of return.
Infrastructure & Cloud covers server costs, API usage, hosting, and any third-party AI model access fees. If you're calling a foundation model via API, you're paying per token, and that cost scales with usage volume. If you're self-hosting a fine-tuned model, you're paying for compute. For a mid-market deployment like our consulting firm example, cloud infrastructure typically runs $1,500–$3,000/month. This number creeps up as adoption scales, so build in a usage-scaling assumption rather than treating it as fixed.
Ongoing Maintenance covers the engineering hours required to keep the system performing well: bug fixes, performance monitoring, retraining models as your data evolves, and adapting to changes in connected systems. AI systems that aren't actively maintained degrade - models drift, integrations break, edge cases accumulate. Annual maintenance typically runs 15–25% of your original development cost. For our $130,000 build, that's roughly $20,000–$32,000 per year, or around $1,700–$2,700/month.
In our hypothetical case, total recurring costs come to approximately $3,500/month. That monthly number is the constant headwind in your cash flow: a cost you're paying from Month 1, through the build phase, through the pilot, all the way to steady state and beyond.
AI generates financial value through two channels. Most organizations are good at identifying one and blind to the other. Getting both right, and being specific about how you arrive at each number, is what separates a defensible business case from a wish list.
Let's continue with the same hypothetical case from Part 1: a 120-person operations consulting firm that has deployed a generative AI copilot to automate report drafting, surface project anomalies, and handle routine client communications. Total initial investment: $203,500. Monthly recurring cost: $3,500. Now let's figure out what it's worth.
Revenue impact breaks into two sub-categories, each requiring a different estimation approach.
New revenue enabled is the business you couldn't do before - or couldn't do at this volume. The key question to ask is: what operational constraint is AI removing, and what does unlocking that constraint make possible?
The formula:
In our consulting firm example, the AI copilot cuts the time each consultant spends on reporting and admin from roughly 40% of their week to around 10%. That's 30% of each consultant's time returned to billable work. Across a team of 40 consultants at an average billing rate of $150/hour, working 160 hours per month, that's roughly 1,920 hours of recaptured capacity per month. Even if only half of that converts to actual billable time, that's 960 additional billable hours, or around $144,000 in potential new monthly revenue.
Your numbers will look different. The formula stays the same: identify the specific constraint the AI removes, calculate the capacity it frees up, and apply your conversion rate and billing rate to get a dollar figure. Avoid the temptation to say "AI will increase revenue by X%" without tracing it back to a mechanism. That's a guess, not a model.
Revenue uplift from existing channels is more subtle: it's the same business, performing measurably better. In our example, faster, more consistent client reporting reduces churn. Real-time project anomaly detection means issues get flagged before they become escalations, improving client satisfaction scores and renewal rates. Faster turnaround on deliverables wins competitive pitches that previously went to whoever responded first.
The formula:
For the improvement percentage, pick one or two specific metrics the AI will directly influence - churn rate, renewal rate, win rate on competitive bids - and apply a conservative 3-7% improvement. In our example, if the firm's monthly recurring revenue from retainer clients is $500,000 and a 5% churn reduction is realistic, that's $25,000/month in protected revenue that would otherwise have been at risk.
As with new revenue, be specific about the mechanism. "AI will improve client satisfaction" is not a model. "Faster reporting reduces the primary complaint in our churn exit interviews, which we estimate will lower monthly churn by 5%" is a model.
Here's where most organizations leave money on the table in their ROI models, because they frame savings too narrowly.
The default framing is headcount reduction: fewer people needed, salary costs go down. That framing is both financially incomplete and organizationally counterproductive. The more accurate, and more financially significant framing is capacity expansion.
In our consulting firm example, the AI doesn't replace any consultants, but gives each of them back 30% of their week. That recaptured time is the asset. The question is what your organization does with it, and modeling that answer honestly is where your cost savings estimate lives.
The formula:
For our case: 40 consultants × 48 recaptured hours/month × $75 loaded cost/hour (salary plus benefits, not billing rate) × 50% productive reallocation rate = $72,000/month in labor value redirected to higher-value work. Note that this overlaps with the new revenue figure above - in practice, you'd choose one framing or the other depending on whether those recaptured hours convert to billable time (revenue) or internal efficiency (cost saving). Don't double-count.
That last variable - productive reallocation rate - is the honest one. In most organizations it sits between 50-70%. Be realistic. Overstating it is where labor savings estimates most commonly fall apart when they meet reality.
Operational efficiency savings come from the automation itself reducing cost-per-deliverable: fewer revision cycles because the AI's first draft is already well-structured, less supervisory time per output, fewer errors reaching the client. In our example, if the firm currently spends roughly $15,000/month on rework and revision cycles, and the AI reduces that by 60%, that's $9,000/month in operational savings.
Other savings - reduced software subscriptions made redundant by the AI, lower compliance overhead from automated audit trails - are real but hard to estimate precisely. Keep this conservative. In our example, call it $2,000/month.
Add everything together to get total monthly benefit at full steady-state adoption:
In our hypothetical case: $144,000 (new billable capacity) + $25,000 (churn protection) + $9,000 (efficiency) + $2,000 (other) = $180,000/month. That's a high-end figure for this scenario, and in practice you'd stress-test each input. The point isn't the specific number - it's the method.
Then apply your profit margin to convert gross benefit into net profit:
For a consulting firm, a 50% margin is reasonable. That gives us $90,000/month in net profit at steady state in our example - the number we'll carry into the phased rollout model in Part 3.
The margin input matters more than most people realize because it applies to every dollar of benefit across all 24 months. A 10-percentage-point swing in margin meaningfully changes both your payback period and your 24-month return. Use your actual business margin if you have it. If you're benchmarking: professional services typically runs 40-60%, software and SaaS runs 60-75%, retail and manufacturing runs lower. When in doubt, be conservative. A model that holds up at 45% margin is a stronger business case than one that only works at 65%.
So, this is the moment when most AI ROI projections fall apart. They assume the benefits start on day one, or close to it: launch the system in January, start collecting $90,000/month in profit by February.
That is not how AI deployments work.
A realistic deployment follows four distinct phases over 24 months. Modeling them honestly is what separates a credible business case from one that creates false expectations - and eventual credibility problems.
Let's walk through all four phases using our consulting firm example: $203,500 in total initial investment, $3,500/month in recurring costs, and $90,000/month in net profit at full steady-state adoption.
For the first four months, you are building. Engineering is underway. Data is being consolidated and structured. Integrations are being developed and tested. Your pilot group is being identified and trained.
During this entire period: zero benefits, ongoing costs.
Every month, the consulting firm is paying $3,500 in recurring infrastructure costs. By the end of Month 4, they've spent $203,500 in initial investment plus $14,000 in recurring costs - and the cumulative position is firmly negative. The system hasn't generated a dollar.
This is uncomfortable for anyone who wants fast ROI, but it's the reality. Modeling it honestly is also useful: it tells you the exact cash flow hole you're committing to before returns arrive, which lets you plan for it rather than be surprised by it.
In Month 5, the system goes live, but not at full scale. You're running a controlled deployment with a subset of users, workflows, or volume. Real usage, real feedback, real edge cases surfacing in real conditions.
The model applies 25% of steady-state benefits during the pilot phase. For our hypothetical consulting firm, that looks like:
After two months of piloting, cumulative profit turns positive for the first time - but you're still well short of recovering the initial investment. The pilot phase isn't about financial return. It's about validating that your benefit assumptions hold in the real world before you commit to full rollout.
This is the most dynamic phase of the model. Adoption increases linearly from 25% to 100% across six months. Each month, more consultants are using the system, more deliverables run through it, more of the projected benefit is being realized.
Here's what that ramp looks like in our example:
By the end of Month 12, the initial investment has been well on its way to recovery, and the firm is approaching full productive capacity. Your own table will look different depending on your numbers - but the shape of the curve will be the same: slow at first, then accelerating as adoption spreads.
One practical note on the ramp: 25% to 100% over six months assumes a smooth, managed rollout - active change management, dedicated user support, and leadership accountability for adoption metrics. In organizations where rollout happens organically (users opt in when they feel like it, training is ad hoc, metrics aren't tracked), this ramp drags. Six months becomes twelve. The payback period extends accordingly. This is why change management isn't a soft cost.
Starting in Month 13, you're at 100% adoption. Every unit of projected benefit is being realized, every month.
This is the phase where the investment truly compounds. Each month adds another $88,250 in net profit. By Month 24, cumulative profit is substantial - well beyond the initial investment, and growing.
That's the honest version of the growth curve: not a hockey stick that starts immediately, but a realistic S-curve that accounts for build time, learning, and ramp-up, and then delivers durable, compounding returns once the system is fully operational. The download template will calculate all of this automatically once you enter your own inputs.
Everything above is the base case. It assumes you execute well, adopt fully, and operate in a market that stays roughly constant. None of those assumptions are guaranteed.
Cloudera found that for 96% of enterprises AI is at least somehow integrated into their processes. Your competitors are evaluating AI right now. Some will adopt faster than you. When they do, your win rates, your pricing power, and your market share will come under pressure, and a model that only worked in a static market will start to look optimistic.
A credible financial model answers a harder question: how much can go wrong before this investment stops making sense?
The template's competition adjustment applies four pressure inputs simultaneously.
Market share erosion (15%): When competitors deploy AI-enhanced capabilities - faster turnaround, better personalization, more competitive pricing - they win business you would have previously won. Your addressable opportunity shrinks. Applied to the model, this pulls your monthly benefit from $95,000 down to $80,750: a $14,250/month reduction that flows through every future period.
How to set this number for your business: look at your market and estimate how quickly competitors are likely to reach AI parity. In fast-moving markets (SaaS, e-commerce, financial services), 15% is conservative - erosion could be steeper and faster. In slower-moving markets (industrial, specialty manufacturing, regulated industries), 5–10% might be more realistic.
The point isn't to be precise; it's to run a scenario that doesn't assume you maintain 100% of your current position forever.
Win rate pressure (10%): Even for the deals you're pursuing, you're closing at a lower rate. Competitors are offering AI-enhanced alternatives - faster proposals, better-tailored solutions, more responsive support. Your win rate erodes. In the template, this is captured in the margin compression rather than as a separate volume reduction.
Price pressure (10%): To stay competitive, you're discounting. This compresses your effective profit margin from 55% to 44% - a 20% relative reduction in profitability. Pricing pressure is one of the most underappreciated AI risks: when your AI-driven efficiencies become table stakes in your market, you can't charge a premium for them anymore. You've invested to maintain parity, not to gain advantage.
Adoption delay (2 months): Competitive disruption can slow your own internal rollout. Sales cycles lengthen as customers become more sophisticated. Implementation complexity increases as you try to differentiate. Add two months to your timeline.
Running all four adjustments together produces a noticeably different, but still compelling picture:
That's a 32% reduction in annual ROI from competitive pressure. Meaningful, but the investment still makes sense. A 204% annual ROI clears almost any reasonable hurdle rate.
The deeper question the competition adjustment is designed to answer is about NPV. With a 10% annual discount rate applied to the 24-month cash flows, the base case NPV is $483,000. A positive NPV means the investment generates more value than the minimum required return on capital.
If you ran the competition-adjusted scenario through the same NPV calculation and got a negative number, that would mean the investment barely clears its cost of capital under realistic market conditions - and you'd want to revisit your assumptions before proceeding.
If your NPV turns negative under even moderate competitive pressure, you don't have a durable investment thesis. You have one that requires everything to go right. That's the scenario worth catching in the model, not after the fact.
Pull all four components together and the model produces a complete financial picture. Using the template's base scenario with the example inputs:
Base case: $209,000 total initial investment. $3,500/month in recurring costs. $52,250/month in net profit at steady state. Payback period of approximately 4 months after reaching steady state - meaning the investment is recovered by Month 13. 24-month net return of $1,038,000. 24-month ROI of approximately 497%. NPV of $483,000 at a 10% discount rate.
Under competitive pressure: Adjusted monthly profit of $35,530. Payback of approximately 6 months post-steady-state. 24-month adjusted return of $636,720. Adjusted annual ROI of 204%.
The executive summary view shows both scenarios side by side - the base case and competition-adjusted metrics - which is exactly what a CFO or board needs to make an informed decision. Not the optimistic scenario, but the range.
Running this model against your own situation is straightforward once you understand what each input actually represents. A few practical notes.
You probably have a real development quote or budget range - use that. For data preparation, if you don't have an estimate yet, start with 15–20% of your development cost for organized data environments, and 25–30% for organizations with significant legacy data complexity. For system integration, 10–15% of development cost is a reasonable starting point for standard integrations; custom or legacy environments can run higher.
This single number has a dramatic effect on your output because it's applied to every dollar of benefit across all 24 months. A swing from 40% to 60% changes your monthly net profit by nearly $19,000 - which changes your payback period by months and your 24-month return by hundreds of thousands of dollars. Use your actual business margin if you have it. If you're in professional services, 50–65% is typical. Software businesses often run higher. Retail and manufacturing run lower.
The most common modeling mistake is assigning a revenue uplift percentage without tracing it to a mechanism. "AI will increase revenue by 15%" is not a model - it's a wish. "AI-assisted qualification will let our sales team work 40% more leads at the same close rate, generating $X in additional closed deals per month" is a model. The more specific you are, the more defensible your numbers are, and the more useful the model is for identifying where to focus implementation effort.
The scenario doesn't assume competitors will immediately match you - it asks whether your investment thesis survives a market that doesn't stay static for 24 months. If the answer requires the base case assumptions to hold perfectly throughout, your thesis is fragile. Better to know that now.
The template includes a clean summary tab designed to be shared with leadership. It shows both the base case and competition-adjusted metrics side by side, with a space for your investment recommendation narrative. That's what belongs in a board deck, not the raw phased rollout table.
Every number in this post came from real formulas applied to real inputs. The same model is available for you to run against your own scenario.
The template has six tabs:
Fill in your numbers. Watch the model build. Then go into your next AI investment conversation knowing exactly what you're committing to, and exactly what you expect in return.
Additionally the toolkit includes AI Prioritization Index and AI Technical Implementation Plan.